TRACE32 Tools for Intel® Processors

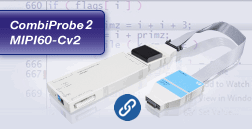
CombiProbe MIPI60-Cv2
• CombiProbe MIPI60-Cv2 provides debug and system trace capability
• Support for standard JTAG, debug HOOKs and I2C bus
• Support for merged debug ports (two JTAG chains per debug connector)
• Support for survivability features (threshold, slew rate, etc.)
• Support for system trace port with up to 8 trace data channels
• 512 MByte of trace memory
• Voltage range 1.0 V to 1.8 V
• SMP debugging (including hyperthreading)
• AMP debugging with other architectures
• BIOS/UEFI debugging with tailor-made GUI for all UEFI phases
• Linux- and Windows-aware debugging
• Hypervisor debugging
• Support for system trace decoding via the Intel® Trace Hub Library

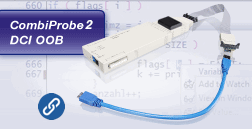
CombiProbe for Intel® DCI OOB
• CombiProbe DCI OOB for closed chassis targets with USB3 port and DCI OOB capability
• CombiProbe DCI OOB provides debug and system trace capability
• Support for standard JTAG, debug HOOKs and system trace via DCI protocol
• 512 MByte of trace memory
• SMP debugging (including hyperthreading)
• AMP debugging with other architectures
• BIOS/UEFI debugging with tailor-made GUI for all UEFI phases
• Linux- and Windows-aware debugging
• Hypervisor debugging
• System trace configuration and decoding via the Intel® Trace Hub library

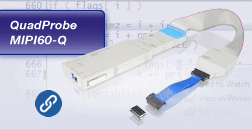
QuadProbe MIPI60-Q
• QuadProbe MIPI60-Q provides debug capability for up to 4 debug connectors on a single target
• Support for standard JTAG, debug HOOKs and I2C bus
• Support for merged debug ports (two JTAG chains per debug connector)
• Support for survivability features (threshold, slew rate, and more)
• Voltage range 1.0 V to 1.8 V
• SMP debugging for multi-socket targets
• SMP debugging of hundreds of threads
• AMP debugging with other architectures
• BIOS/UEFI debugging with tailor-made GUI for all UEFI phases
• Linux- and Windows-aware debugging
• Hypervisor debugging

